Telegraf Snmp Hp Switch Monitoring
27 Mar 2018Monitore a HP 1810-24G Switch (J9450A) with telegraf, influxdb and grafana over snmp. Sounds complicated and convoluted but it's not I swear.
Basically you need to do two things. (Well if you have a running telegraf, influxdb and grafana setup and your HP switch has snmp enabled)
The plan was to use ifXTable but for a reason unknown to me it didn't work. So here is the inputs.snmp config I use:
[[inputs.snmp]]
    agents = [ "SWITCH_IP:161" ]
    community = "notpublic"
   [[inputs.snmp.field]]
     name = "hostname"
     oid = "SNMPv2-MIB::sysName.0"
     is_tag = true

    # Port 01
    [[inputs.snmp.field]]
       name = "if_01_name"
       oid = "IF-MIB::ifName.1"
    [[inputs.snmp.field]]
       name = "if_01_speed"
       oid = "IF-MIB::ifSpeed.1"
    [[inputs.snmp.field]]
       name = "if_01_in_octets"
       oid = "IF-MIB::ifInOctets.1"
    [[inputs.snmp.field]]
       name = "if_01_out_octets"
       oid = "IF-MIB::ifOutOctets.1"
    [[inputs.snmp.field]]
       name = "if_01_in_error"
       oid = "IF-MIB::ifInErrors.1"
    [[inputs.snmp.field]]
       name = "if_01_out_error"
       oid = "IF-MIB::ifOutErrors.1"

....

    # Port 24
    [[inputs.snmp.field]]
       name = "if_24_name"
       oid = "IF-MIB::ifName.24"
    [[inputs.snmp.field]]
       name = "if_24_speed"
       oid = "IF-MIB::ifSpeed.24"
    [[inputs.snmp.field]]
       name = "if_24_in_octets"
       oid = "IF-MIB::ifInOctets.24"
    [[inputs.snmp.field]]
       name = "if_24_out_octets"
       oid = "IF-MIB::ifOutOctets.24"
    [[inputs.snmp.field]]
       name = "if_24_in_error"
       oid = "IF-MIB::ifInErrors.24"
    [[inputs.snmp.field]]
       name = "if_24_out_error"
       oid = "IF-MIB::ifOutErrors.24"
The full config can be found here to copy & paste: fliiiix/2921c168182b27b27d8aca2bdb5f83b0
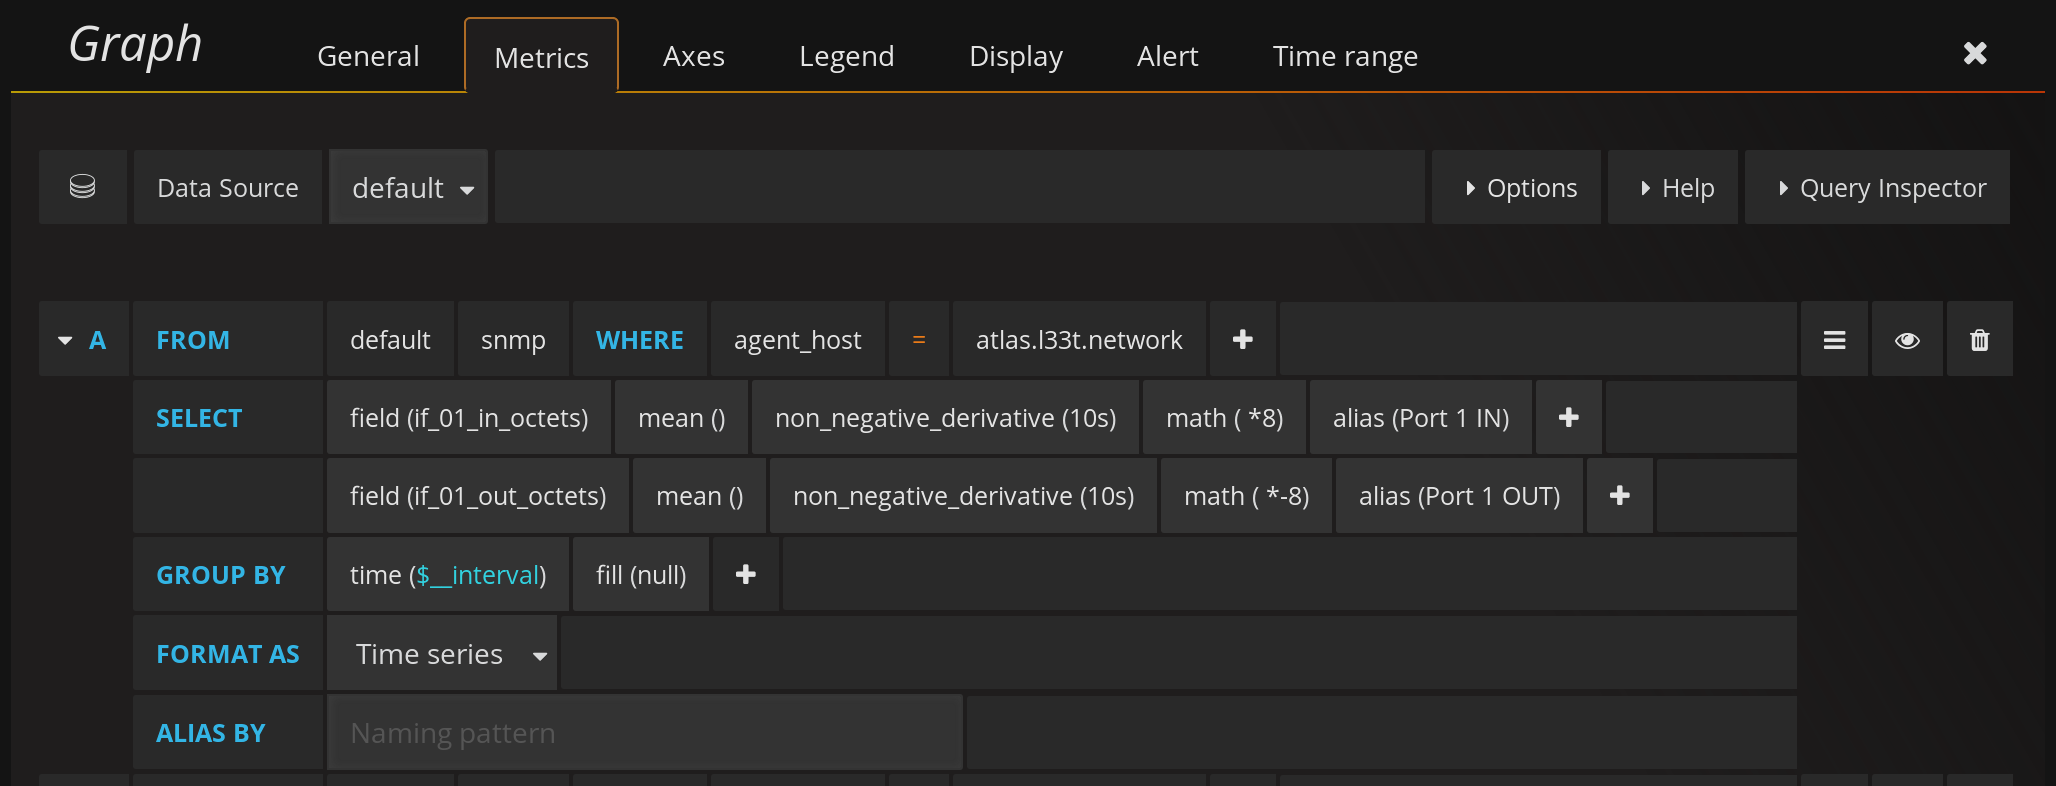
And then the second step is to create a the graph in grafana.

Note: it's times 8 because the value you get over snmp is octets. And don't forget to change the Unit to bits/sec on the Units tab.
If you are lazy and need all 24 ports on one dashboard here you can find my config. Don't forget to search and replace my hostname (atlas.l33t.network) with your hostname.