Cpu Temperature Monitoring
24 May 2020I had the issue that my Plex Transcoding started failing after I watched some Movies. After some debugging and guessing I think the issue is the CPU Temperature.
So here is quick way to check on the CLI how the CPU is doing every 2 seconds: (At least on FreeBSD)
while true; do sysctl dev.cpu | grep temperature; sleep 2; ; done
This is handy to debug and look at the CPU Temperature.
But that is not a way to constantly monitor forever.
So I packed this logic into my telegraf.conf like this:
[[inputs.exec]]
  commands = ["sh -c 'sysctl -n dev.cpu.0.temperature | tr -d C'"]
  name_override = "cpu_temp"
  timeout = "5s"
  data_format = "value"
  data_type = "float"
  [inputs.exec.tags]
    core = "core0"

[[inputs.exec]]
  commands = ["sh -c 'sysctl -n dev.cpu.1.temperature | tr -d C'"]
  name_override = "cpu_temp"
  timeout = "5s"
  data_format = "value"
  data_type = "float"
  [inputs.exec.tags]
    core = "core1"

....
As you can see there is a inputs.exec for each CPU core.
Which can result in a grafana dashboard.
Here is the one I built:
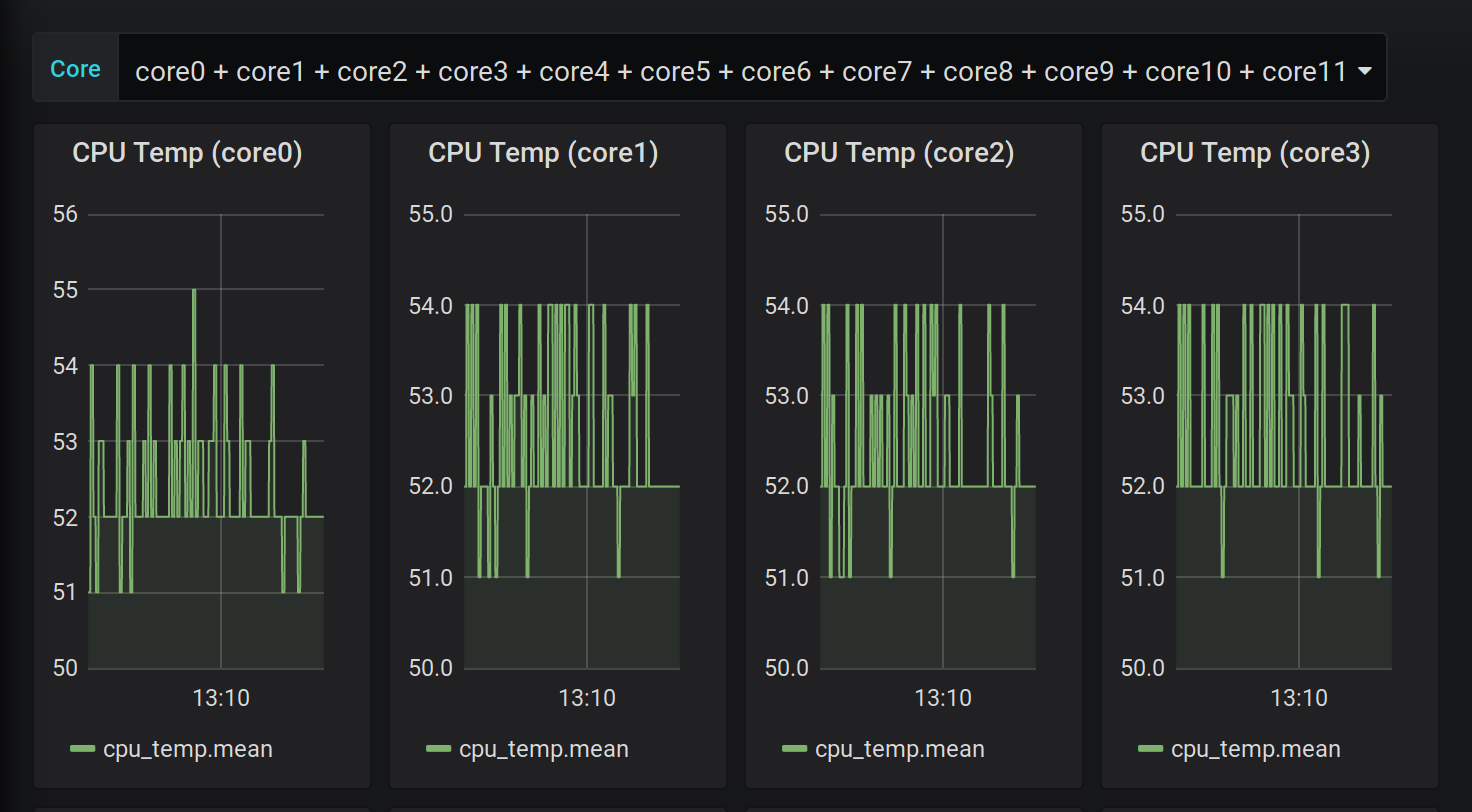
The code for that is for your convenience in this gist.
Probably a few things need to be adjusted.
For example host.domain.tld needs to match your hostname sent by your telegraf configuration.
But this will not solve the issue of the CPU running to too hot. It just presents me a fancy graph when it is happening.
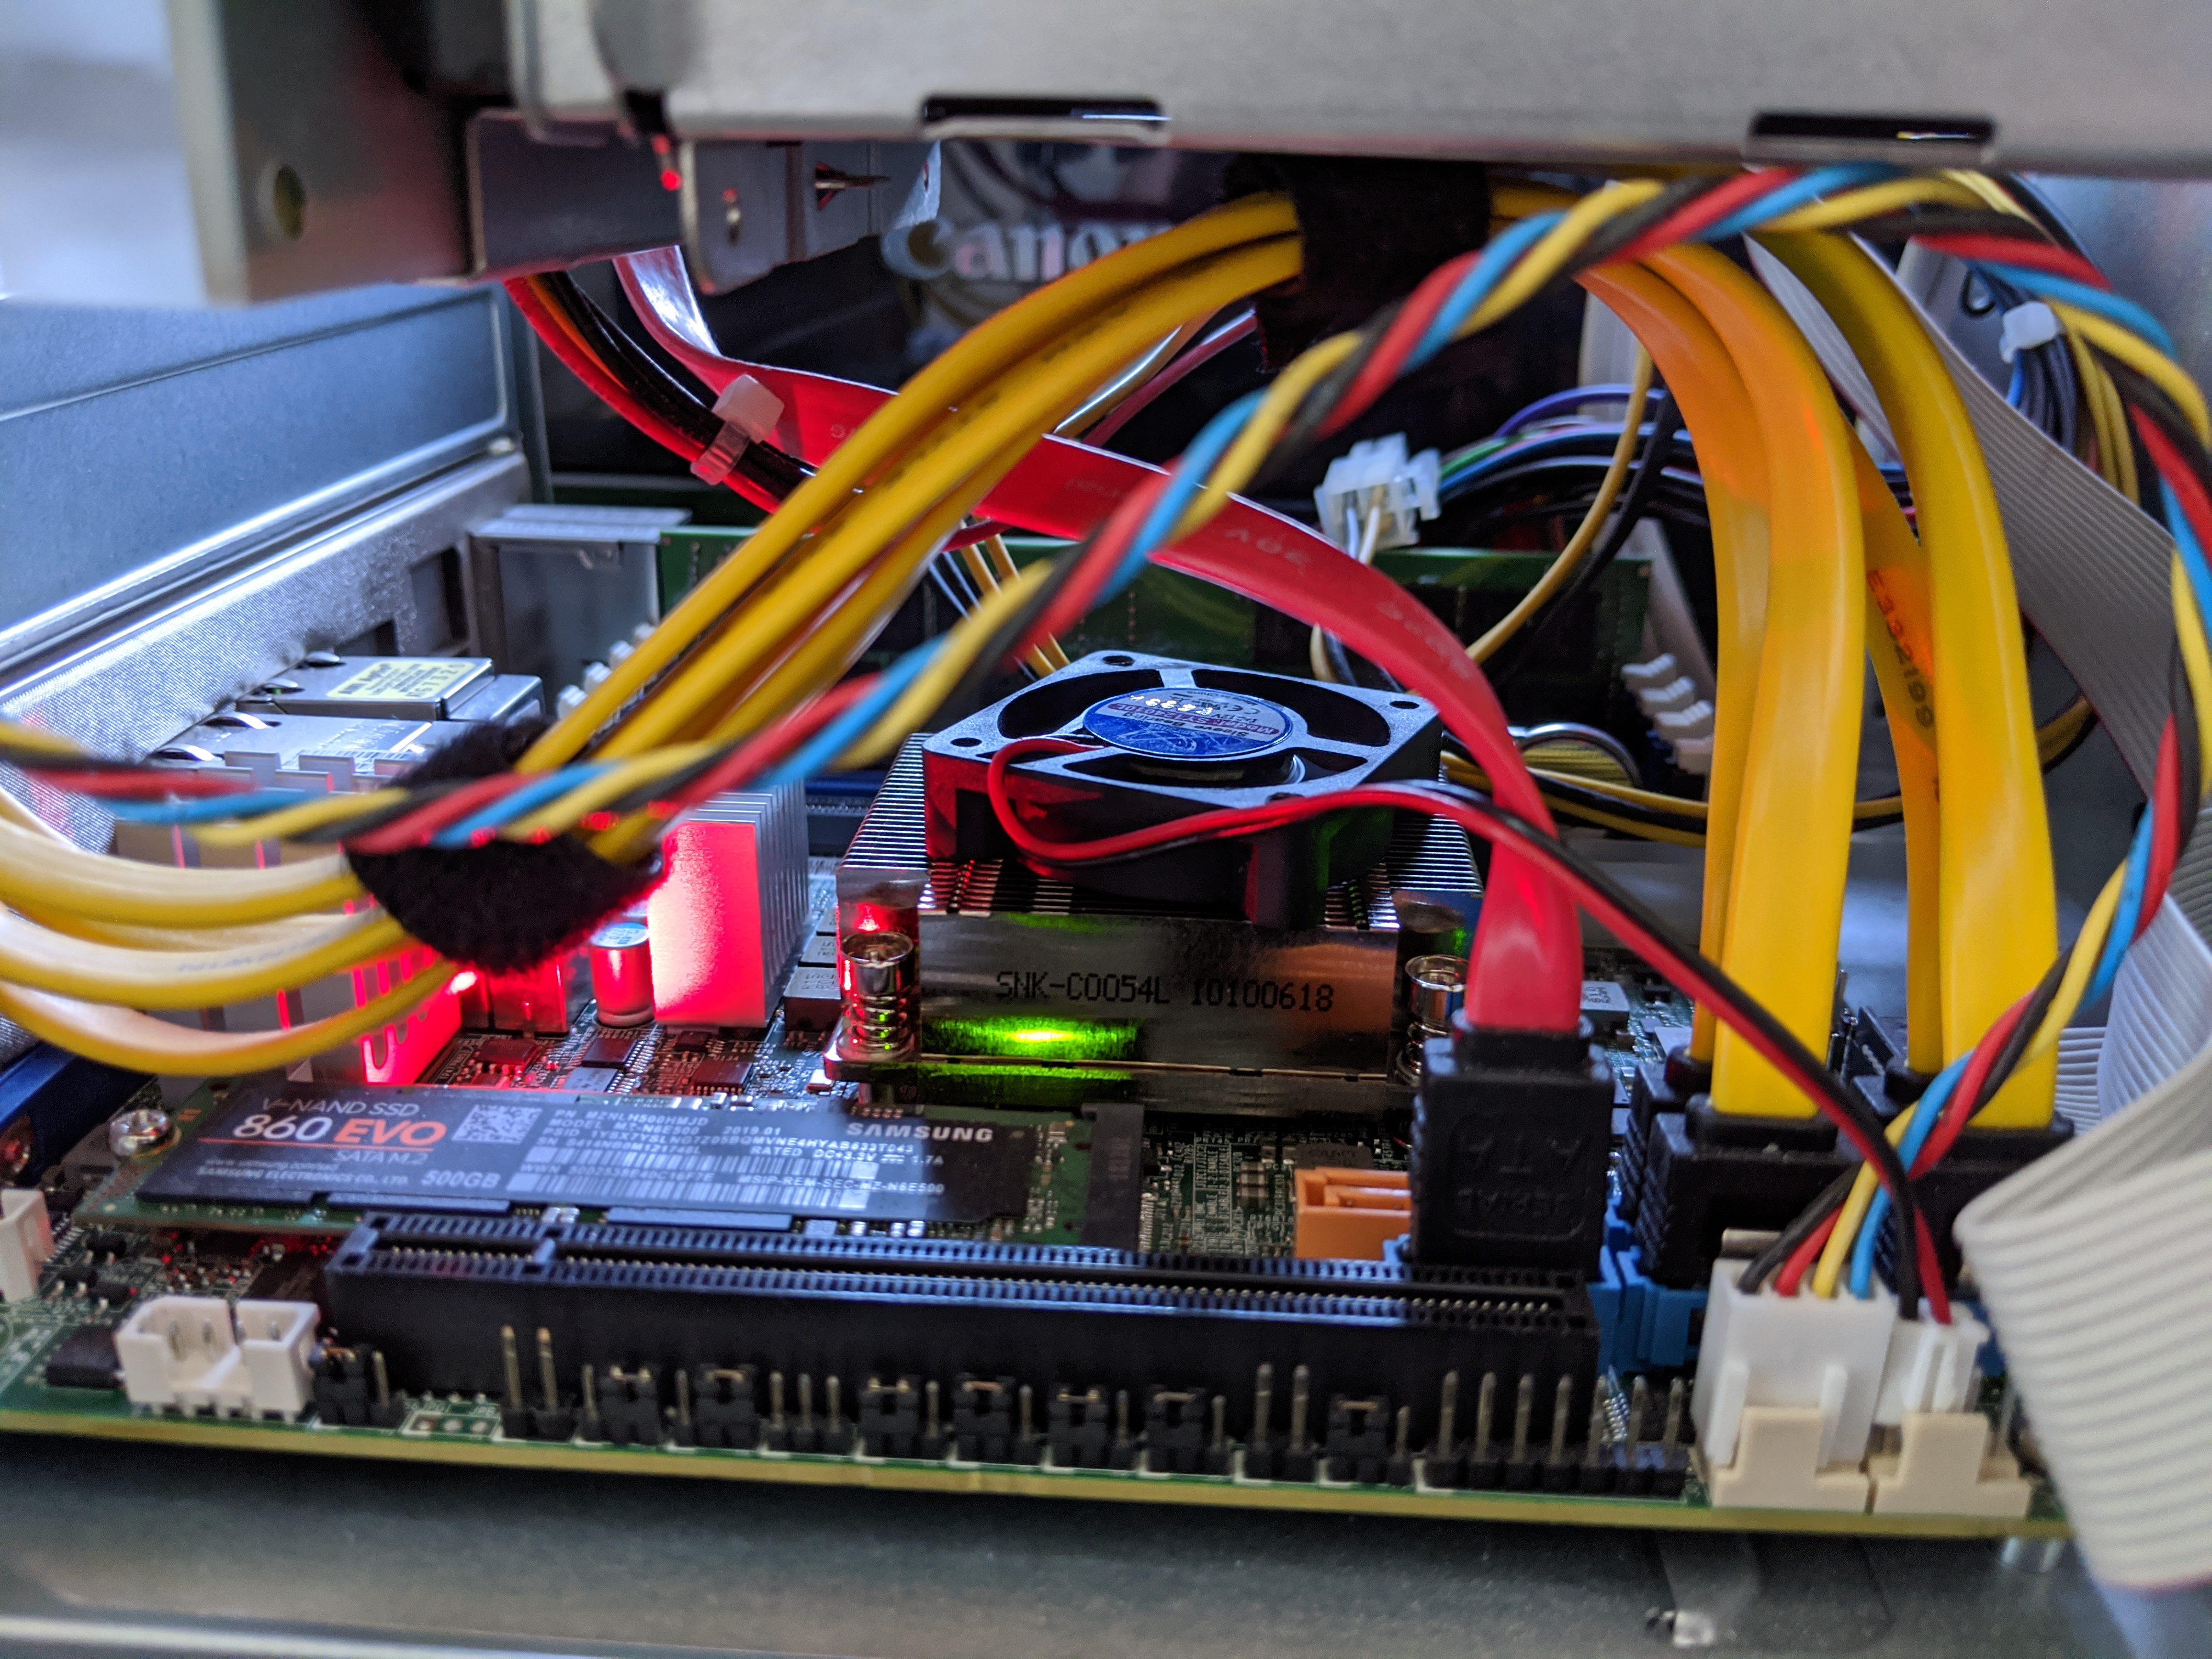
So I 'built' a crappy solution for that as well. I got a fan out of a old Cisco Catalyst switch and put it on top of the heatsink. And according to my monitoring it works surprisingly well. Maybe I get a propper cooling solution for the MBD-X10SDV-6C-TLN4F-O or not time will tell.